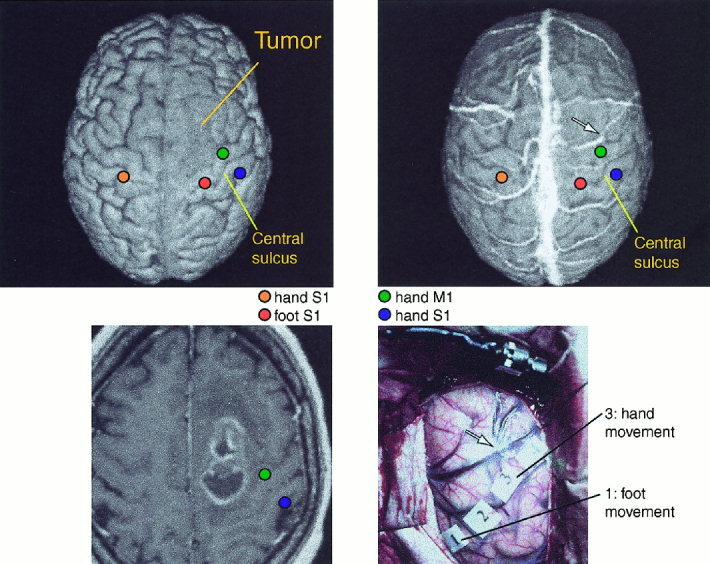
Figure 3.

Above: Preoperative 3‐D surface renderings of the brain of Patient 12, without (left) and with (right) superimposed veins. Sources of responses to right median and left median and tibial nerve stimulation are overlaid on the surface rendering. Below, left: horizontal MRI section showing the tumor and sources of MEG‐EMG coherence to left wrist extension, and SEFs to left median nerve stimulation. Below, right: Intraoperative photograph showing venous structure and stimulation sites used to define the motor cortex location. The arrow in the MR surface rendering and in the photograph point to the same vein. The distance between the source of maximum MEG‐EMG coherence and stimulation site was 6 mm.
