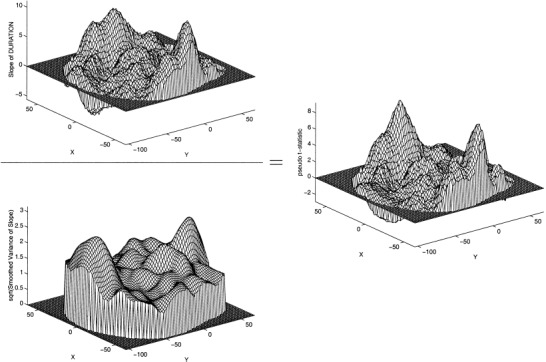
Figure 3.

Mesh plots of permutation analysis, z= 0 mm. Upper left: Slope estimate. Lower left: square root of smoothed variance of slope estimate. Right: pseudo t image fot=r DURATION. Note that smoothness of pseudo t image is similar to that of the slope image (c.f. figure 2).
