
Figure 4.
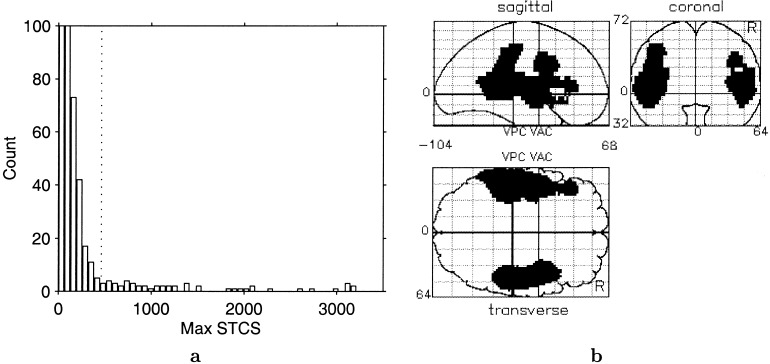
A: Distribution of maximum suprathreshold cluster size, threshold of 3. Dotted line shows 95th percentile. The count axis is truncated at 100 to show low‐count tail; first two bars have counts 579 and 221. B: Maximum intensity projection image of significantly large clusters.