
Figure 7.
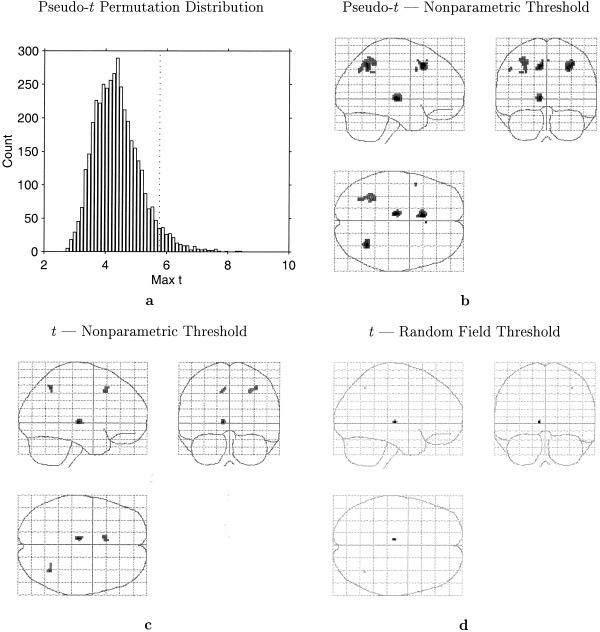
A: Permutation distribution of maximum repeated measures t statistic. Dotted line indicates the 5% level corrected threshold. B: Maximum intensity projection of pseudo t statistic image threshold at 5% level, as determined by permutation distribution. C: Maximum intensity projection of t statistic image threshold at 5% level as determined by permutation distribution. D: Maximum intensity projection of t statistic image threshold at 5% level as determined by random field theory.