
Figure 1.
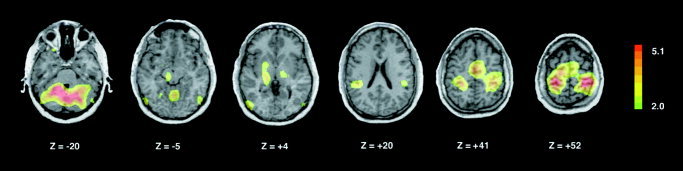
Brain map illustrating increases in regional cerebral blood flow (rCBF) during ASL noun repetition (vs. passive viewing of signed nouns). Statistical parametric maps are displayed on a standardized MRI scan, which was transformed linearly into stereotaxic (Talairach) space. Scans are displayed using neurological convention (left hemisphere is represented on the left). Planes of section relative to the bi‐commissural line are indicated. Values are Z‐scores representing the significance of voxel‐wise increases in normalized rCBF. The range of scores is coded in the accompanying color table (right).