
Figure 10.
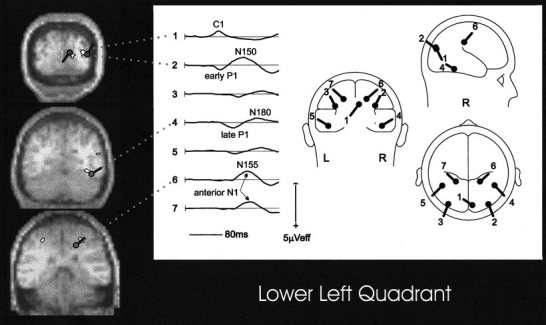
Spatial correspondence between dipole models fitted to the grand‐average VEP and sites of activation in the grand‐average fMRI in response to stimuli in the lower left quadrant. For the late P1 and N155 the dipole locations were situated anteriorly to the plane of the MRI/fMRI section by 15 and 8 mm, respectively. See Tables III and IV for data from all 4 quadrants.