
Figure 11.
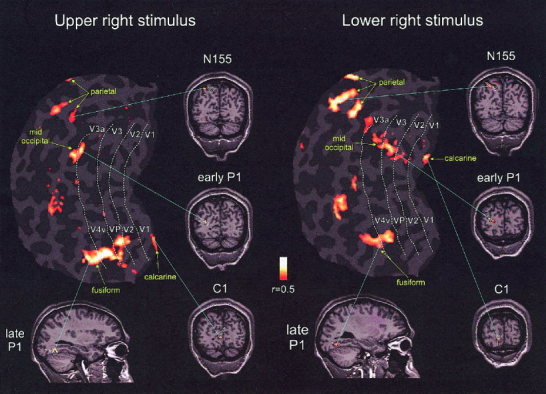
Spatial correspondence between dipole models fitted to the grand average VEP and fMRI activations in a single subject (KD). fMRI activations and retinotopic mappings of visual areas for upper and lower right field stimuli were projected onto a flattened cortical representation of the left hemisphere. Dashed white lines represent the boundaries of visual areas traced from visual field sign maps (sulcal cortex, dark gray; gyral cortex, light gray). Coronal and saggital sections display the same activations before flattening. The circles with pointers indicate the fitted dipoles from the grand‐average VEP model in response to the same stimuli.