
Figure 7.
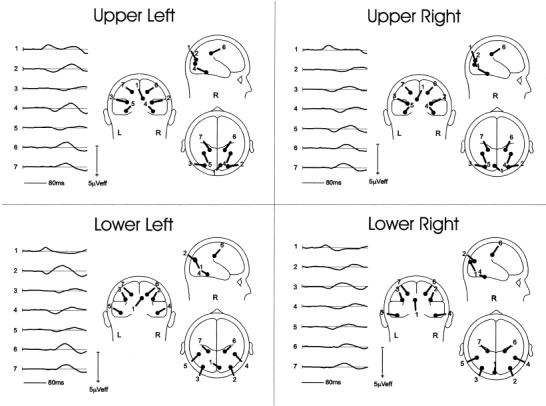
BESA dipole models fitted to the grand‐average VEPs to stimuli in the four visual field quadrants. Waveforms at the left of each model show the time course of source activity for each of the modeled dipoles. Dipole 1 corresponds to the C1 component, dipole pair 2‐3 to the early P1, dipole pair 4‐5 to the late P1, and dipole pair 6‐7 to the N155.