
Figure 9.
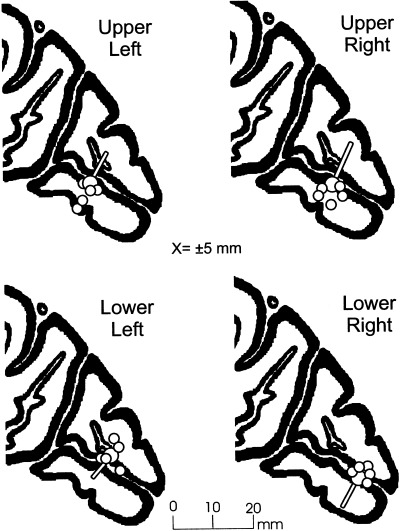
Anatomical correspondence between the modeled dipoles for the C1 component (large circles with pointers) and sites of activation in the calcarine fissure shown by fMRI (small circles) in response to the same stimuli in 5 individual subjects. In these saggital views both the dipole positions and the centers of calcarine activation are shown in Talairach space.