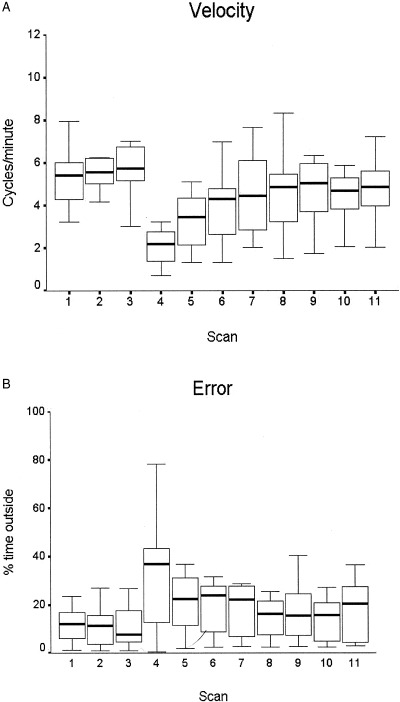
Figure 3.

Behavioral data. A: Velocity of tracing, calculated as number of completed cycles around the star path in each trial of 60 sec. Median, interquartile interval and range are shown. The median for velocity in the eleven trials were significantly different (Kruskal‐Wallis test H = 37.893, P < 0.001 calculated from the chi‐square distribution with 10 degrees of freedom). Tracing scans: 1–3. Mirror tracing scans: 4–11. B: Error calculated as percentage of the tracing time in which the cursor was outside the path, with the same conventions as in (A). The difference between trials was not significant (P = 0.238, Kruskal‐Wallis test).
