
Figure 1.
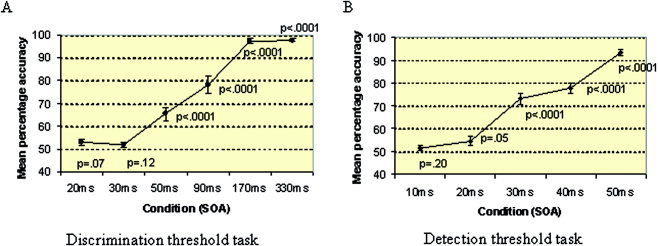
Mean percentage accuracy for SOAs in threshold setting discrimination task (A) and detection task (B). P‐values indicate whether or not accuracy at each SOA differed significantly from a chance‐level performance of 50%.
Official websites use .gov
A
.gov website belongs to an official
government organization in the United States.
Secure .gov websites use HTTPS
A lock (
) or https:// means you've safely
connected to the .gov website. Share sensitive
information only on official, secure websites.
Mean percentage accuracy for SOAs in threshold setting discrimination task (A) and detection task (B). P‐values indicate whether or not accuracy at each SOA differed significantly from a chance‐level performance of 50%.