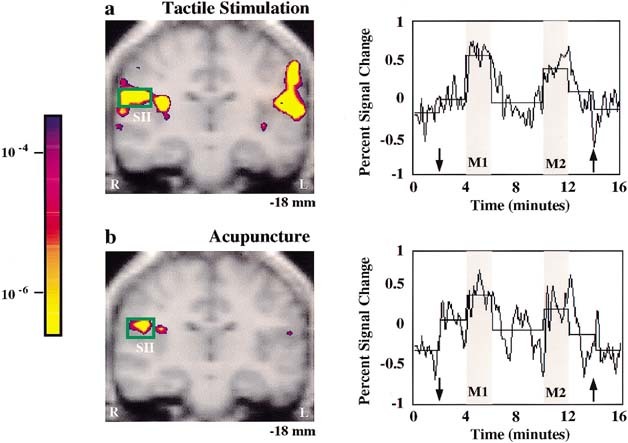
Figure 3.

Signal increases in SII: tactile stimulation versus acupuncture needle manipulation at left LI 4 in the same subjects (n = 3). Group averaged data is presented in pseudocolor KS‐statistical maps of signal increases overlaid on gray scale high resolution scan with the time course of normalized signal intensity from the activated voxels as indicated by the green box. Note that SII signal increases occurred during both treatments, but the regional extent of brain activation was greater and the statistical significance more robust during tactile stimulation (a) than during acupuncture (b) see Table I. The time course of signal change correlated with the experimental paradigm. The horizontal line of each epoch represents the average signal intensity of that epoch.
