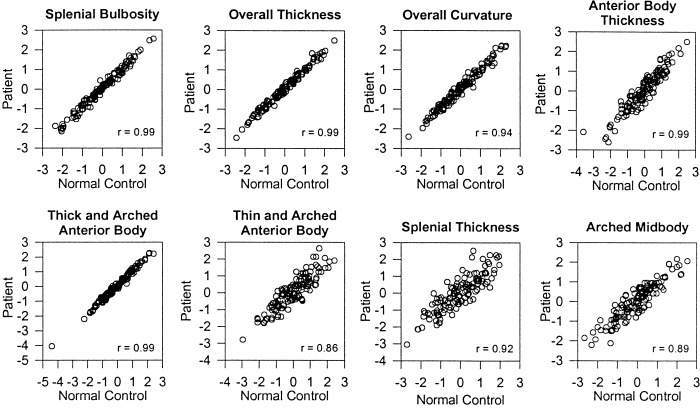
Figure 4.

Reliability of the factor structures. The scatterplots represent the relationship between 1) the factor scores calculated from the normal subject data (x axis) and 2) the factor scores calculated by multiplying the factor coefficients derived from the patient data with the normalized point coordinates of the normal subject data (y axis). The Pearson correlation coefficients are provided in the lower right corner of each plot. The corresponding plots for the factor scores calculated from the patient data are not presented because they are similar to these plots.
