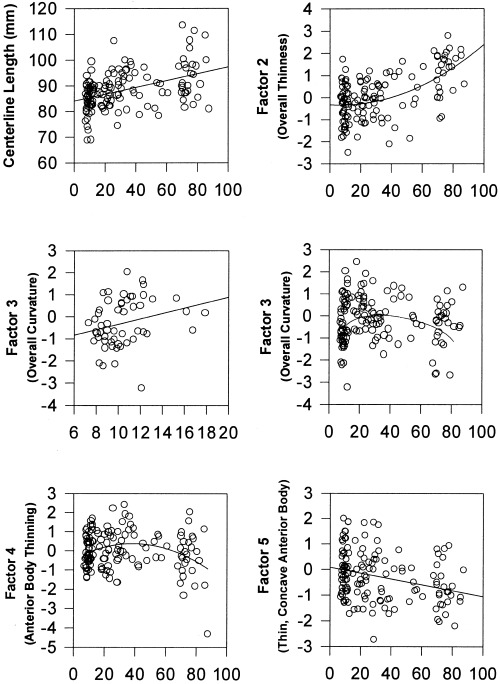
Figure 5.

Age‐related changes in CC measures. The plots represent correlations of factor scores with age in only the normal subjects of the sample (N = 138). The factor numbers on the y axis correspond with the factor numbers in Figure 2. Upper left: the length of the centerline increases progressively with age. Changes are evident by early adulthood. Upper right: overall thinness of the CC (factor 2) increases with age2. Middle left: the CC progressively flattens with age during childhood and adolescence (the positive correlation with factor 3 reflects decreasing curvature). The scatterplot is presented only through late adolescence so that the association with age in this period of development can be more readily appreciated than it can, for instance, in the scatterplot for all subjects (middle right). Middle right: although the CC flattens in the first and second decades of life (factor 3, middle left figure), curvature then progressively increases with age in adulthood. Lower left: the anterior body of the CC increases in thickness and arches (factor 4) during childhood before thinning and becoming more concave in adulthood. Lower right: the anterior body becomes progressively thinner and more concave with age (factor 5).
