Figure 6.

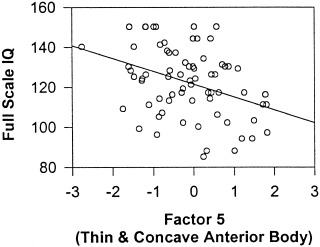
IQ correlations. Higher full‐scale IQ scores are associated with more negative scores for factor 5 (β = ‐0.31, P < 0.007), which represents a thinner and more concave anterior body of the CC.

IQ correlations. Higher full‐scale IQ scores are associated with more negative scores for factor 5 (β = ‐0.31, P < 0.007), which represents a thinner and more concave anterior body of the CC.