
Figure 1.
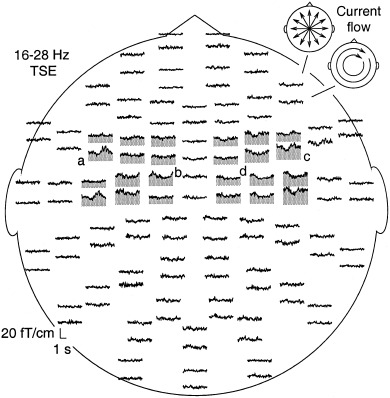
Whole‐head view of the mean amplitude of 16–28 Hz activity (Temporal Spectral Evolution, TSE) in one subject during the kissing task (KISS) over a 4‐sec interval, including a 1‐sec prestimulus baseline. The measurement helmet is viewed from above, and flattened to the plane, with the nose pointing upwards. Time flows along the horizontal axis and the magnetic field changes along the vertical axis. Neuromag‐122™ records maximum signal directly above an active cortical area. The 122 sensors are arranged in 61 locations. In each location, there are two sensors that are most sensitive to orthogonally oriented currents (see schematic views in the upper right corner). The TSE level in the sensors showing clear task‐related modulation of 20‐Hz activity is high‐lighted by grey shading. The letters a–d indicate groups of sensors displaying distinct time behaviors.