
Figure 5.
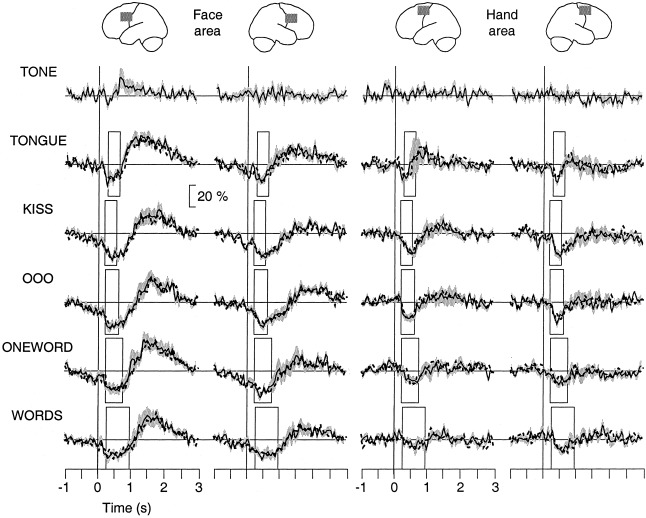
Task‐related modulation of 20‐Hz activity in the left and right face and hand areas (columns) as percent of local base level, averaged across subjects (SEM = grey shading). The different tasks are displayed as rows. The time window extends from 1 sec before tone prompt to 3 sec after it. The rectangles indicate the EMG durations in the different tasks. TSE waveforms averaged with respect to tone and EMG onset are plotted as solid and dashed curves, respectively, and overlaid.