
Figure 6.
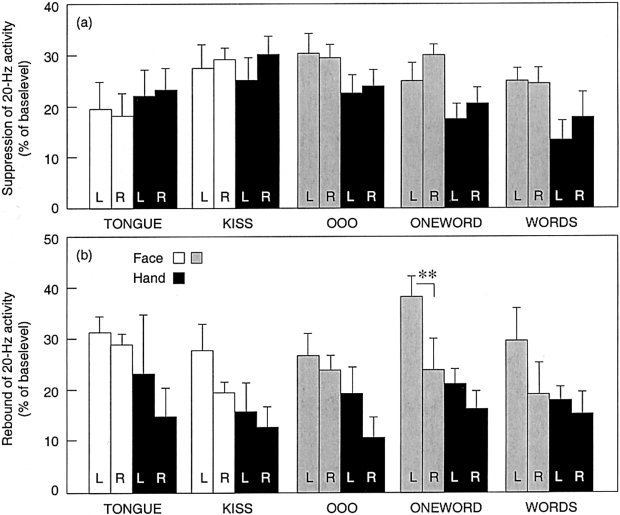
Mean ± SEM suppression (a) and rebound (b) of 20‐Hz activity as percent of base level in the left (L) and right (R) face and hand areas during the different tasks. The hand area modulation is plotted with black bars and face area modulation with white bars for the non‐verbal tasks and with grey bars for the verbal tasks (**P < 0.01).