
Figure 2.
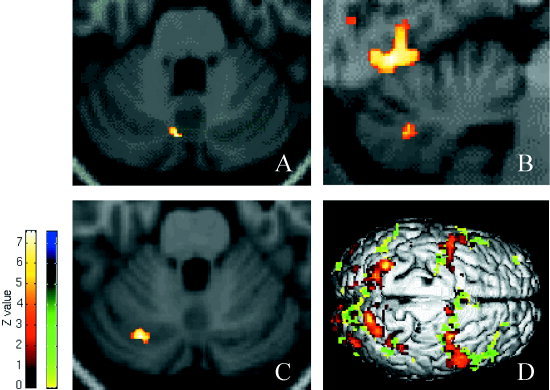
Group analysis data (6 volunteers) demonstrating the activation of the posterior vermal lobules VI–VII by visually guided saccades (VG) in transversal (A) and sagittal projection (B). C: The triple‐step task (TR) predominantly activates the left lobuli VI‐crus I (5 volunteers, one excluded because of movement artefacts). D: Cerebral activation foci by visually‐guided saccades (red) including the network comprising of the frontal eye field, supplementary eye field, parietal cortex, and visual areas. The activations of the cerebellar hemispheres, lobuli VI–VII, during the triple‐step task are accompanied by prefrontal activations (green). The activation pattern by visually‐guided saccades is plotted on top of the triple‐step saccades. The color bars represent the corresponding Z‐values (left for a–c, right including the overlay map in d).