
Figure 3.
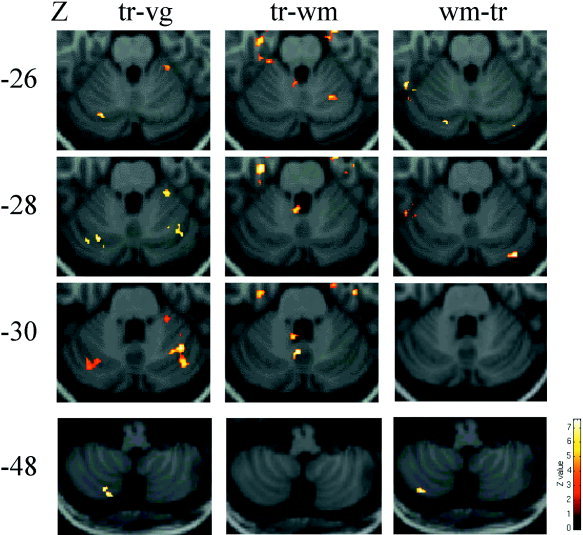
Group analysis data of the differential task design. TR with VG as control (tr‐vg, 6 volunteers) predominantly activated areas within the lobules VI‐crus I and the lower part of the left cerebellar hemisphere (left) corresponding to the lobule VIIB‐VIII. TR with WM as control (tr‐wm) revealed activation within the vermal/left paravermal region (middle), whereas the reverse condition (wm‐tr, 3 volunteers) demonstrated predominant hemispheric activation of areas within lobule crus I (right). The color bar represents the corresponding Z‐values.