
Figure 3.
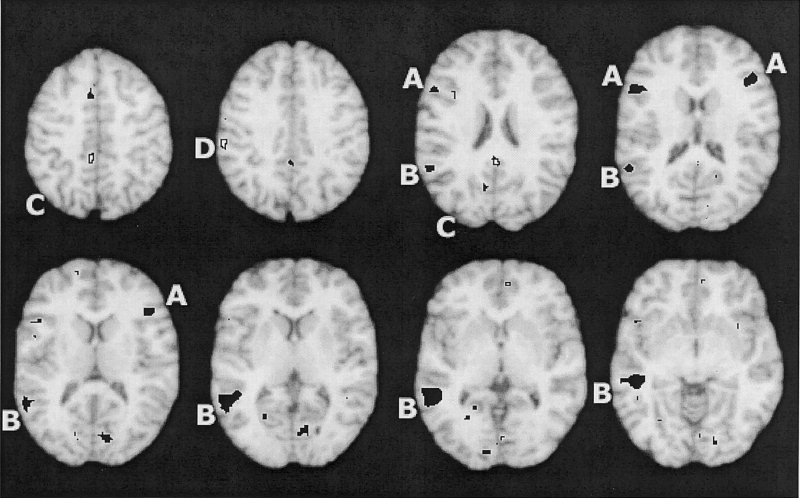
Activation maps for task differences that are independent of modality. Letters label regions of interest. Solid black indicates areas of significantly more activation in the meaning than in the rhyming task. (A: inferior frontal gyrus; B: middle temporal gyrus). Black borders indicate areas of significantly more activation in the rhyming than in the meaning task. (C: middle to posterior cingulate gyrus; D: supramarginal gyrus). The left side of the brain is on the left.