
Figure 2.
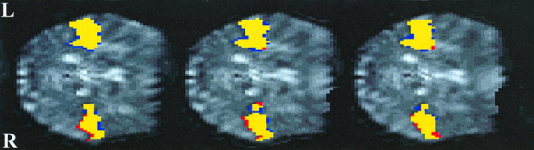
Contiguous axial slices showing the relative distribution of activation during passive listening to static and modulated tones, contrasted against resting baseline. Activation maps are superimposed onto the mean normalised functional image through the superior temporal cortex. Yellow represents voxels that are significantly activated by both modulated and static tones during passive listening (P<0.001). Red denotes voxels that are significantly activated by static tones alone, whereas blue denotes voxels activated by modulated tones alone. There is a very close correspondence between the two activation patterns.