
Figure 3.
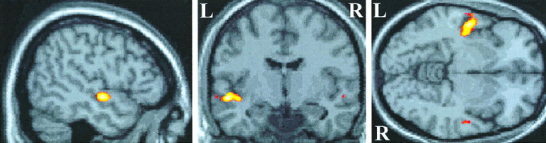
Location of preferential activation induced by modulated tones compared with static tones. Activation is projected onto sagittal, coronal, and axial views of a canonical T1‐weighted image through the point in standard brain space corresponding to −50, −8, −6 mm in the x, y, z planes. Activation is anterior and inferior to Heschl's gyrus on the superior temporal gyrus and is predominantly left‐sided.