
Figure 4.
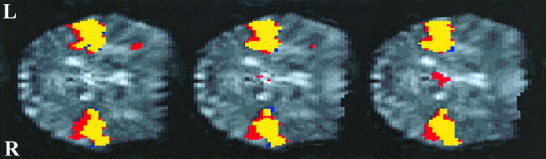
Relative distribution of activation during both active and passive listening to the static tones, contrasted against resting baseline. Activation maps are shown for contiguous axial slices superimposed onto the same mean normalised functional slices used in Fig. 2. Yellow represents voxels that are significantly activated by both active and passive listening (P<0.001). Red denotes voxels that are significantly activated by active listening alone, whereas blue denotes voxels activated by passive listening alone. Active listening induces a posterior spread of activation, particularly in the right superior temporal cortex. A similar distribution of relative activation was obtained for the modulated tones.