
Figure 3.
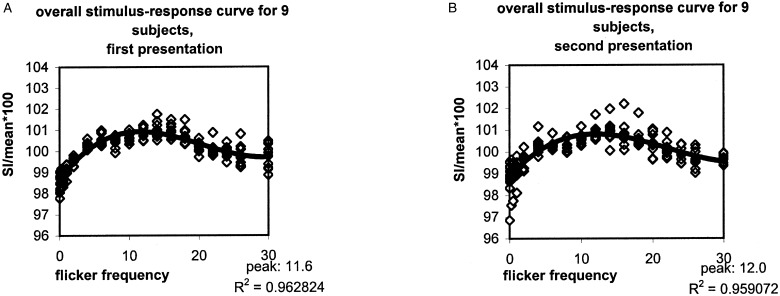
Average stimulus–response curve across nine subjects for the first (A) and the second (B) parametrical flicker presentation task. Open white squares represent average SI for each subject at each frequency. Filled black squares represent the overall average SI for each frequency for nine subjects. The polynomial curve could be fitted to the overall average SI for each frequency, showing the peak response.