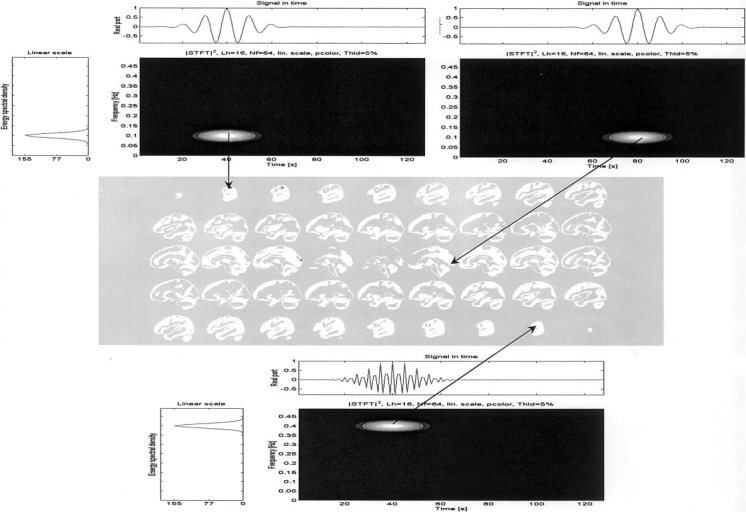
Figure 1.

Simulated sources positions, time courses, frequency spectrum and time‐frequency behavior. The tip of each arrow marks the position of the source on the sagittal slices of an averaged brain The arrows link the sources to their corresponding spectra (shown at the left), time course (top) and time‐frequency coefficients.
