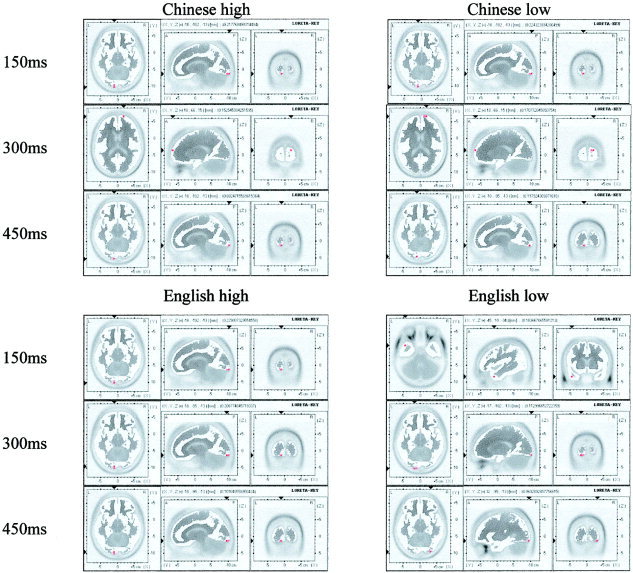
Figure 2.

The LORETA maps for four experiment conditions with 150‐msec interval. Each map consists of axial, sagittal, and coronal planes showing the same activation area. Axial: left‐left, top‐anterior; sagittal: left‐anterior, top‐superior; coronal: left‐left, top‐superior. (A 50‐msec interval version of this figure can be accessed online at http://www.pitt.edu/~liuying/loreta_hbm_01.jpg and http://www.pitt.edu/~liuying/loreta_hbm_02.jpg.)
