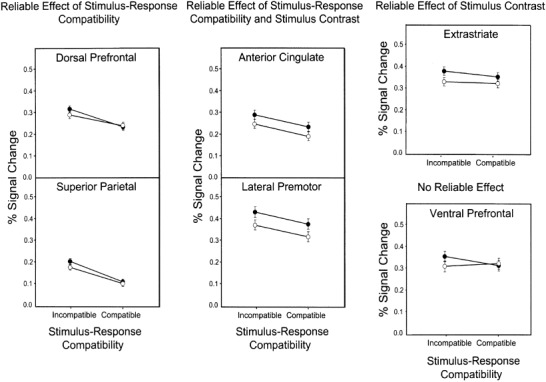
Figure 2.

Signal change (mean percent and SE bars) for the effects of stimulus–response compatibility and stimulus contrast relative to the fixation baseline condition in six regions of interest: dorsal prefrontal, superior parietal, anterior cingulate, lateral premotor, extrastriate, and ventral prefrontal cortices. Open circles indicate high contrast; solid circles indicate low contrast.
