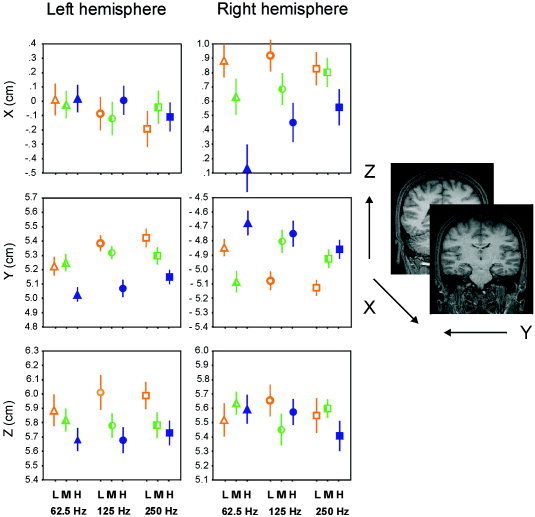
Figure 2.

Source location as a function of stimulus spectrum (empty bullets for LOW [L], half‐filled bullets for MID [M], and filled bullets for HIGH [H]) and stimulus pitch (triangles for 62.5 Hz, circles for 125 Hz, and squares for 250 Hz). Data averaged across subjects. Positive x values for anterior positions, positive y values for left positions, and positive z values for superior positions. Lines represent the standard error.
