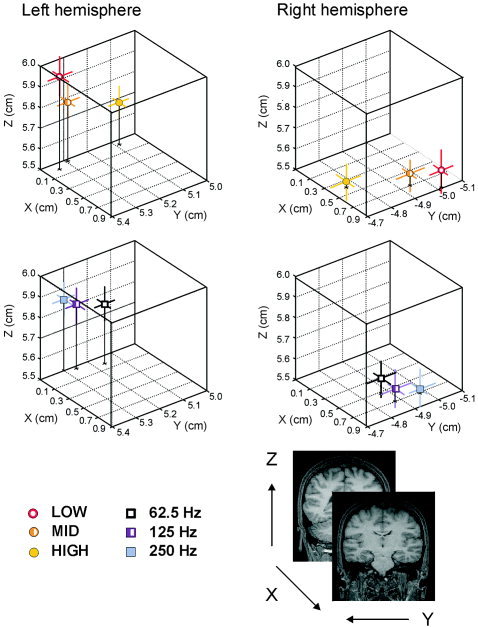
Figure 3.

3‐D portrayal from a back view with Fo data collapsed to show source positions for each spectrum (LOW, MID, and HIGH) (top) and with CFs collapsed to show source locations for each pitch (62.5, 125, and 250 Hz) (bottom). The lines represent the standard errors in each of the axes.
