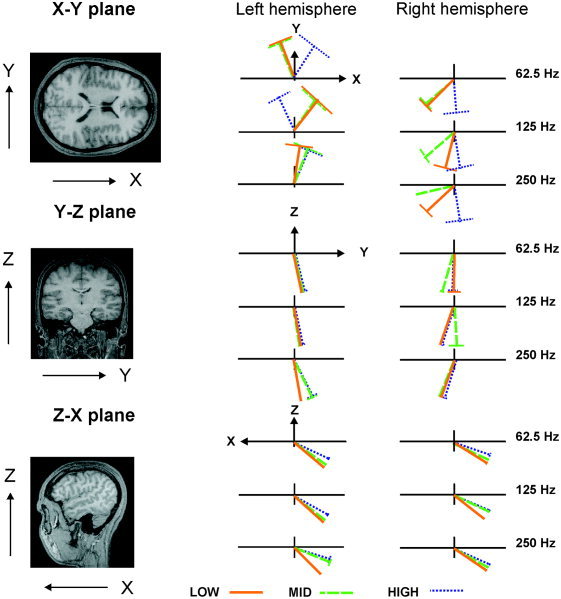
Figure 4.

Source orientation variations as a function of stimulus spectrum and stimulus pitch. Data averaged across subjects. x–y plane view from top, y–z plane view from front, and z–x view from left. The perpendicular lines represent the standard errors.
