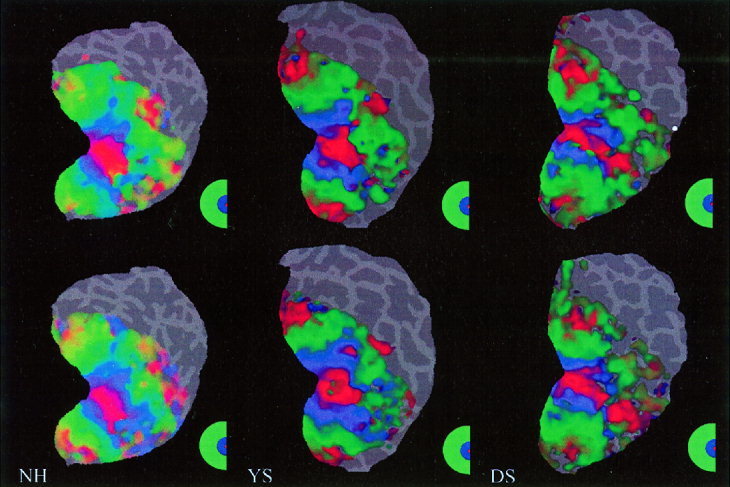
Figure 3.

Retinotopic maps with/without EEG electrodes. The top row shows the retinotopic maps of the right visual hemifield in three different subjects (NH, YS and DS). Subsequently, 64 EEG electrodes were then placed on the subjects' head. The bottom row shows the retinotopic maps (right visual hemifield) of the same subjects wearing the EEG cap within the 3 T magnet. The small differences between the two‐retinotopic maps are due to normal physiological variations.
