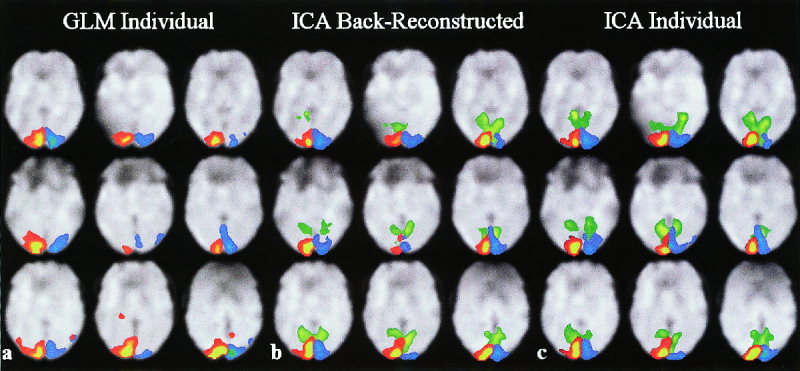
Figure 7.

(a) Single subject results for GLM, (b) back‐reconstructed ICA, and (c) individual ICA. A single slice is presented for each of the nine subjects depicting activation significantly activated when the right (red) and left (blue) visual fields were stimulated. A transiently task‐related component located in the visual cortex is also depicted on the ICA images (green).
