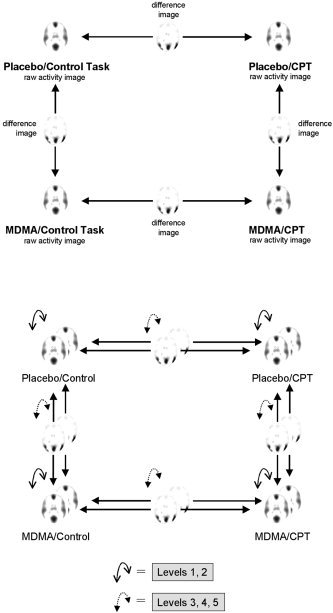
Figure 1.

Top: Comparisons between conditions performed within each imaging modality separately (PET and LORETA). Bottom: The different levels of analysis to compare results across imaging modalities (PET vs. LORETA, shown as superposed layers). Levels 1 and 2: comparison of raw images; levels 3–5: comparison of differences images. See text for further explanation.
