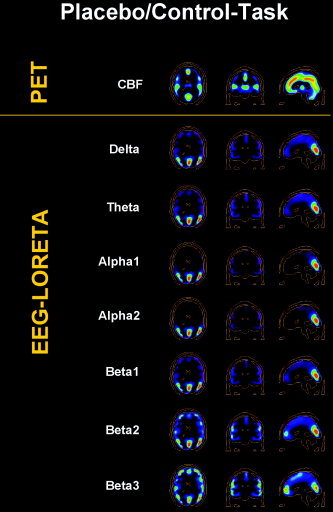
Figure 2.

Brain activity during the control task after administration of a placebo, shown in transverse, coronal, and sagittal view. Top row: CBF as measured by [H2O]‐PET. Following rows: Neuroelectric activity as computed by LORETA for seven frequency bands. Brighter hues indicate stronger activity. Images are sliced at z = 22 mm (transverse), y = −26 mm (coronal), and x = 0 mm (sagittal), with the coordinate origin located at the anterior commissure.
