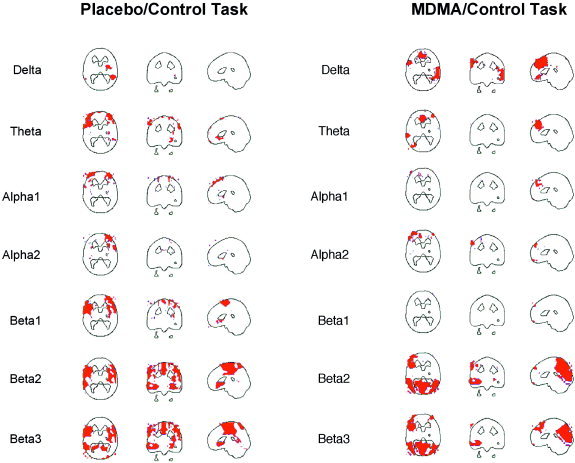
Figure 3.

Correlations between CBF and neuroelectric activity in the different frequency bands during the control task under placebo (left) and MDMA (right). Positive correlations above the significance threshold of r = 0.6 are shown in red. No negative correlations emerge. Except for the delta band, images are sliced at z = 22 mm (transverse), y = −26 mm (coronal), and x = 0 mm (sagittal), with the coordinate origin located at the anterior commissure. The delta band transverse views are sliced at z = −14 mm in order to better show the regions of correlations.
