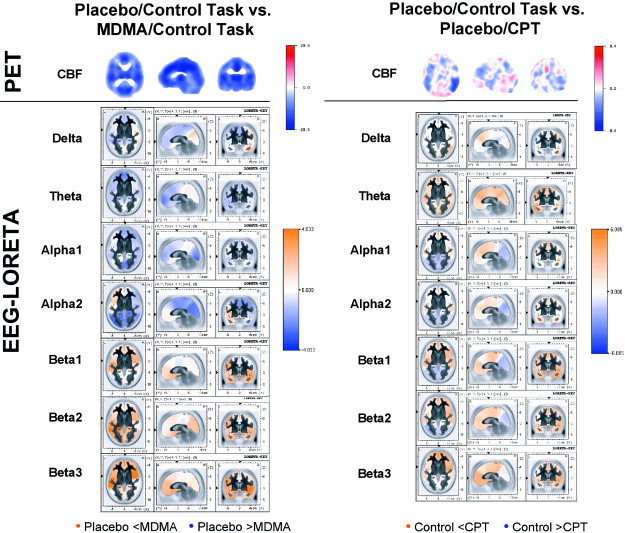
Figure 4.

Color‐coded images showing the differences between placebo and MDMA during the control task (left) and the difference between the control task and the CPT during placebo (right), expressed as t‐value distribution. Orange of increasing intensity indicates increasing positive t‐values, blue of increasing intensity indicates increasing negative t‐values. Top rows: CBF as measured by PET. Following rows: Neuroelectric activity as computed by LORETA. The LORETA t‐images of different frequency bands are scaled to a common maximum to make them directly comparable. PET images are sliced at z = 22 mm (transverse), y = −26 mm (coronal), and x = 0 mm (sagittal), with the coordinate origin located at the anterior commissure. LORETA images are sliced at the anterior commissure.
