
Figure 3.
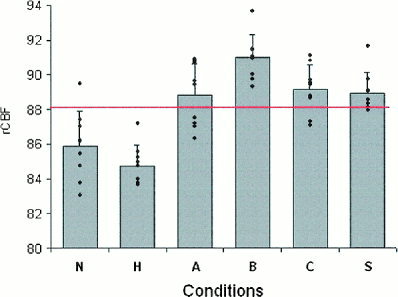
Regional cerebral blood flow (rCBF) in the right orbitofrontal gyrus in response to visual stimuli. Means, standard deviations and individuals values are in ml dl−1 min−1. rCBF is higher when presented stimuli contain women (conditions A, B, C, and S) than when women do not appear (conditions N and H). Red line indicates level of grand mean. Coordinates relative to anterior commissure: x = 22, y = 32, z = 16. See text for description of conditions.