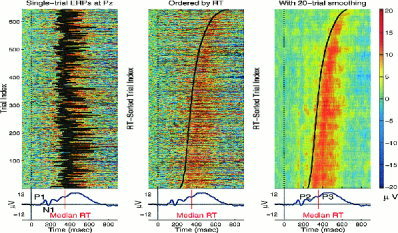
Figure 2.

ERP images of single‐trial target response data from a visual selective attention experiment. (Left) Single‐trial ERPs recorded at a parietal electrode (Pz) from the control subject and time‐locked to onsets of visual target stimuli (left thin vertical line) with superimposed subject response times (RT) (thick black line). (Middle) The same 645 single trials, sorted (bottom to top) in order of increasing RT. (Right) The same sorted trials smoothed with a 20‐trial moving window advanced through the data in one‐trial steps to increase response signal‐to‐noise ratio and minimize the influence of EEG activity not consistently time‐ and phase‐locked to experimental events. The average of all 645 trials, shown below each ERP image, contains characteristic peaks (including the indicated P1, N1, P2, and P3 peaks) whose systematic relationships to behavioral RT are most clearly visualized in the right and central images.
