
Figure 3.
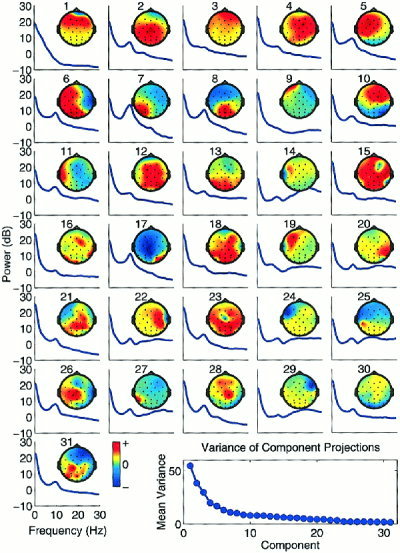
The scalp maps and power spectra of the 31 independent components derived from target response epochs from a 32‐year‐old autistic subject. Blink and eye movement artifact components (IC1 and IC9) had a typical strong low frequency peak. Temporal muscle artifact components (i.e., ICs 14, 22, 27, and 29) had characteristic focal optima at temporal sites and power plateaus at 20 Hz and higher. Some components captured oscillatory activity (i.e., ICs 7, 8, 17, etc.). Some components included features that systematically time‐ and phase‐locked to stimulus onsets or subject responses (Fig. 5).