
Figure 7.
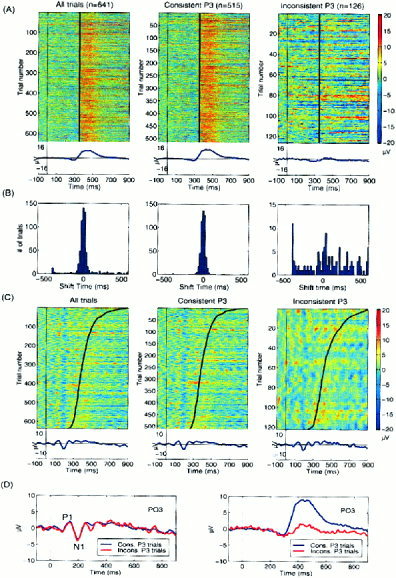
Analysis of variability in the P3 component in single trial ERPs. (A) Summed projections of the four ICA components to left‐posterior site PO3 accounting for response‐locked P3 activity (left) could be separated into 515 consistent‐P3 trials (middle), whose activations resembled those of the averaged P3‐component activation (r = 0.3), and 126 inconsistent‐P3 trials (right) (r < 0.3) whose average (bottom right trace) did not resemble the averages of the consistent trials (middle trace) or of all the trials (right trace). To better illustrate intertrial differences, the ERP images are unsmoothed. (B) Distributions of latency shifts yielding maximal correlations between the P3 template (A, bottom left trace) and each response‐aligned trial, for (left) all trials, (middle) the 515 consistent‐P3 trials, and (right) the 126 inconsistent‐P3 trials. Note that P3 waveforms of most of trials were consistently time‐locked to the subject's responses, as evidenced by a tight concentration near zero‐time shift in the left and center histograms. However, the maximally correlated shift times for the inconsistent trials (right) had no central tendency. (C) ERP images of projected stimulus‐locked activity at site PO3 for (left) all, (middle) consistent, and (right) inconsistent‐P3 trials appear similar. (D) Averages of (blue) consistent‐P3 and (red) inconsistent‐P3 trials. (Left) Summed projected stimulus‐locked components produce identical early P1/N1 response peaks at site PO3. (Right) Summed projected response‐locked components at site PO3 produce dramatically different responses for the two trial subsets.