Figure 1.

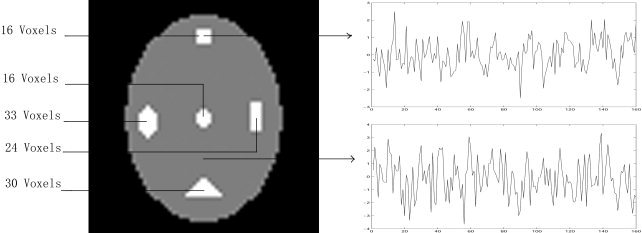
Simulated fMRI data. The white box represents sites of artificial activated regions. The top right‐hand graph depicts the time series of an activated voxel, and the bottom right‐hand graph displays the time series of a non‐activated voxel.

Simulated fMRI data. The white box represents sites of artificial activated regions. The top right‐hand graph depicts the time series of an activated voxel, and the bottom right‐hand graph displays the time series of a non‐activated voxel.