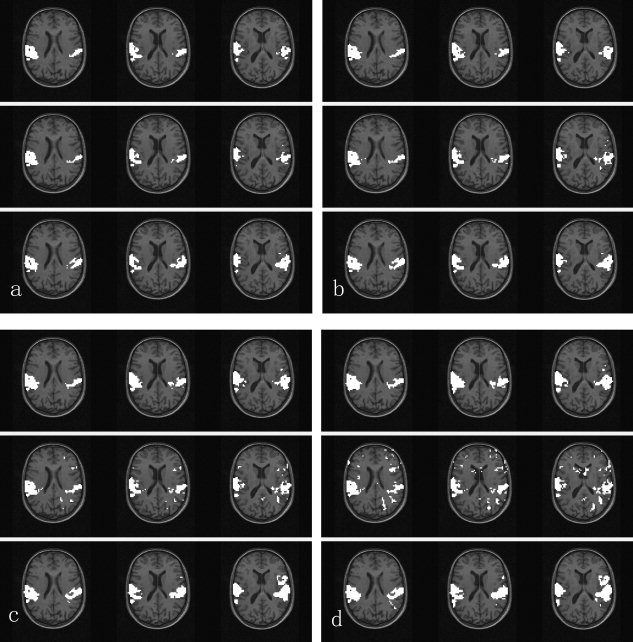
Figure 4.

Activation maps revealed by each of the three methods, i.e., GLM, FCA, and SMRG, shown from the top row to the bottom of the figure. Three slices (29–31 of 64 slices) involved in the auditory experiment are shown. Left side corresponds to right hemisphere. a–d: are results of the three methods corresponding to GLM thresholded at the voxel‐wise significance level of P < 10−7, P < 10−6, P < 10−5, and P < 10−4, respectively.
