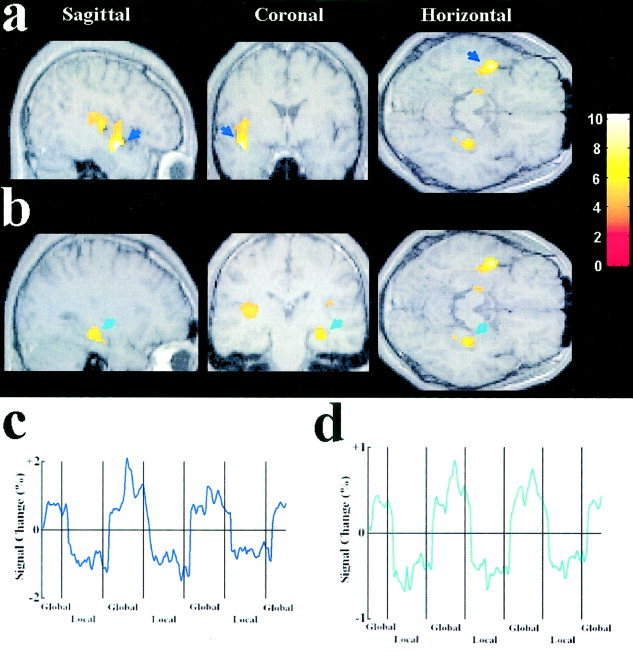
Figure 2.

Brain areas activated by attention to the global level of bilateral compound stimuli. The results of the group analysis from 10 subjects were plotted on MR images of a representative subject. Threshold for activation of all clusters was P < 0.01 (corrected). The color bar indicates the scale of z values. a: Activations in the left temporal cortex (indicated by blue arrows). b: Activations in the right temporal cortex (indicated by green arrows). c: The time course of the signal change in the left superior temporal cortex as a function of global/local attention, averaged across the 10 subjects. The mean image values obtained from the average of the six scans were used as baseline. d: The time course of the signal change in the right inferior temporal cortex as a function of global/local attention, averaged across the 10 subjects. The x‐axis of the time course is for the whole session which contained 6 scans. Each local segment of the time course contains two 30‐sec epochs in two successive scans. The second and third global segments contain two 30‐sec epochs in two successive scans whereas the first and the fourth global segments contain one 30‐sec epoch in the first and the sixth scan, respectively. The time courses were averaged from raw fMRI signals.
