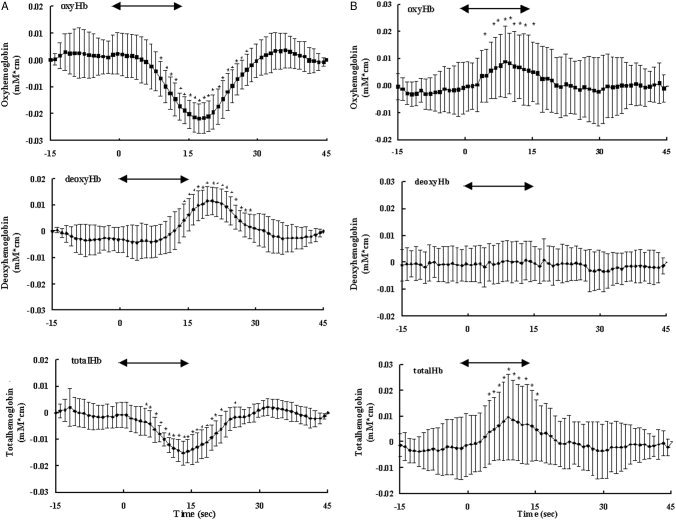
Figure 4.

Grand averages of changes in [oxyHb] as a function of time in the same subjects as those for whom results are shown in Figure 3. From the 24 source‐detector signals, the signal with the greatest change in [oxyHb] in each subject was selected for statistical analysis. A: Average from 10 trials in an infant. B: Average from eight trials in an adult. The arrow indicates the 15‐sec period of visual flashlight stimulation. Changes in [oxyHb], [deoxyHb] and [totalHb] are given in mM · cm. The data were obtained every 130 msec and averaged for 1 sec. Error bars = SD of the mean. *Significance of mean concentration changes from 5 sec before the start of photostimulation (Wilcoxon's signed‐rank test; *P < 0.05).
