
Figure 5.
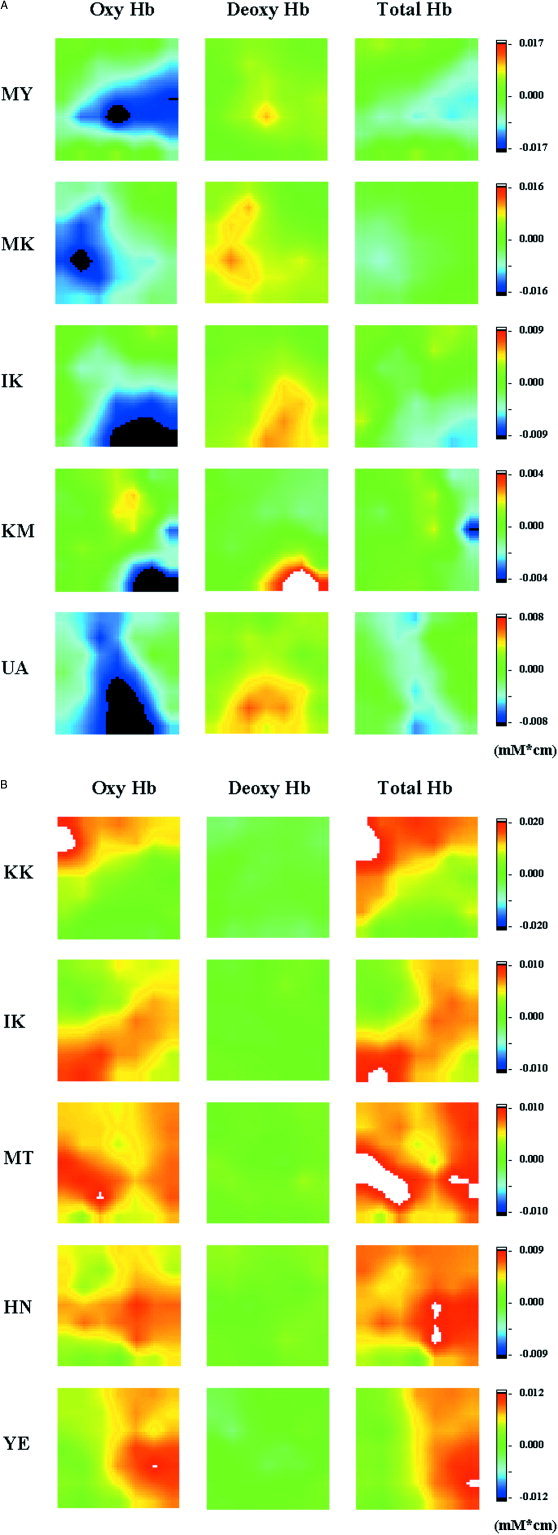
Dynamic 2D images of [oxyHb], [deoxyHb], and [totalHb] in all five infants (A) and five adult volunteers (B). Images were taken at the time when the [oxyHb] signal reached to minimum or maximum value in the channel showing the signal with the greatest changes in [oxyHb] from among the 24 channels.