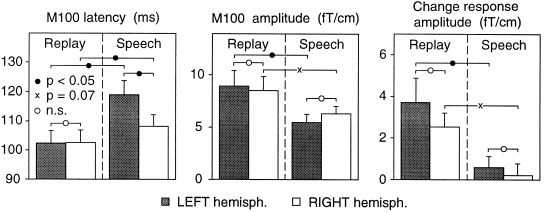
Figure 2.

Latencies and amplitudes of magnetic brain responses to vowels. Mean + SEM of eight right‐handed subjects. Left: M100 peak latencies of responses to self‐uttered (SPEECH) and replayed (REPLAY) vowels. The M100 peak amplitudes are presented in the middle panel, and the amplitudes of the change‐related responses in the right panel.
