
Figure 2.
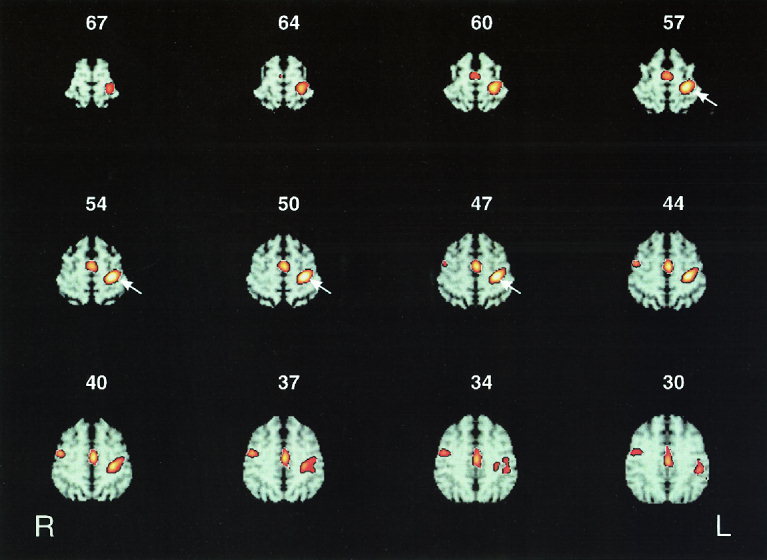
Twelve axial sections of color‐coded statistical Z‐score maps showing regions of significant relative increases in normalized rCMRglc at the level of the primary sensorimotor area representing the hand (SM1HAND), the supplementary motor area (SMA) and the anterior cingulate cortex (ACC). The number at the top of each axial section denotes the axial position relative to the intercommissural line in millimeters. For illustrative purposes, the statistical parametric maps are superimposed onto corresponding axial sections of stereotactically normalized T1‐weighted MRI images and thresholded at an uncorrected P value of 0.01. Right side of the axial sections corresponds to the left hemisphere. White arrows delineate the stimulated left SM1HAND. In addition to a relative increase in normalized rCMRglc in the stimulated left SM1HAND, suprathreshold rTMS at a mean frequency of 2 Hz resulted in relative rCMRglc increases in the caudal parts of the SMA and the ACC on the medial wall of the hemispheres as well as in the right precentral gyrus on the hemispheric surface.