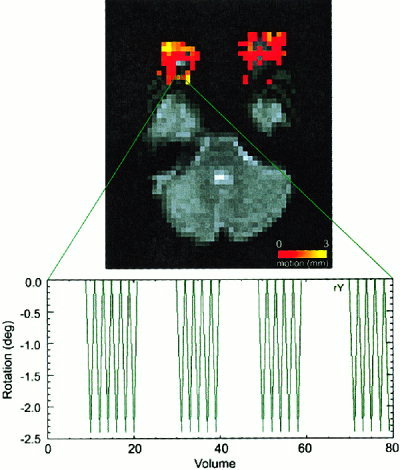
Figure 2.

Results of a local movement registration analysis. The color map corresponding to the amount (mm of average translation and rotation arc length) of local motion is overlaid on the echo‐planar image. Rotational (yaw) movement parameters from a single voxel near the optic nerve are plotted at bottom.
