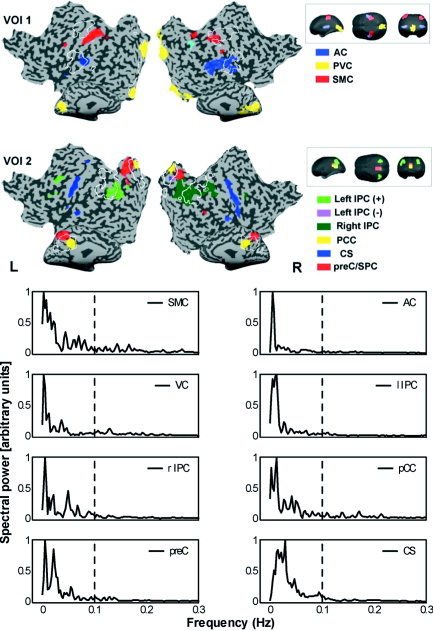
Figure 1.

Upper panel: COIs obtained by using the first (VOI 1) and second (VOI 2) set of VOIs of Subject 6. Colors indicate the different COIs. White lines on flatmap indicate borders of VOI templates. Insets: VOI templates of first and second VOI set presented in glass brain format. Lower panel: Estimate of power spectral densities of the COI time courses (normalized according to maximum value of power), showing that highest powers are found within the low to very low frequency range (0.01–0.1 Hz). Broken line indicates 0.1 Hz. For explanation of abbreviations, see abbreviation list and text.
